

Stop 5% Daily Busts: Daily Drawdown Strategy for Funded Traders

If your daily loss hits 3%, cut your size in half; if it hits 5%, stop trading and diagnose before you place another order. That single tripwire, applied every session, is what separates traders who recover from a bad week and traders who blow the account. Check two things before your next trade: your current drawdown percent from today’s starting balance, and whether your last 15 trades show a rhythm of discipline or a rhythm of chasing losses.
TL;DR:
- Traders should set their red stop at 3% daily loss and halt trading entirely at 5% loss to prevent account blowouts.
- Recognizing that a 20% loss requires a 25% gain to recover emphasizes the importance of limiting drawdowns early.
- A tiered protocol with predefined thresholds and actions helps traders manage risk and avoid emotional decision-making during drawdowns.
- Tracking current drawdown before each trade and adjusting risk accordingly reduces the likelihood of exceeding limits.
- Practicing the risk management framework through simulated challenges ensures discipline before applying it to live funded accounts.
Table of Contents
- What Daily Drawdown Actually Means for Your Account
- Why a 20% Loss Needs a 25% Gain to Fix
- The Three-Tier Protocol: Green, Amber, Red
- How to Track Your Drawdown Before Every Trade
- The Recovery Framework: Diagnose, Pause, Right-Size, Validate, Scale
- Position Sizing by Drawdown Band, With Real Numbers
- Why Revenge Trading Makes Drawdown Worse
- Practicing the Protocol on a FundedAxe Challenge
- The Discipline Nobody Talks About
- Practice the Protocol Before You Trade It Live
- Sources
- FAQ
What Daily Drawdown Actually Means for Your Account
Daily drawdown measures how much your account has lost from a fixed starting point, usually today’s opening balance, reset every 24 hours. It is not the same number as your total or “max” drawdown, which tracks losses from your account’s all-time peak. Confusing the two is a common and costly mistake, especially for funded traders juggling both limits at once.
There are two ways firms and traders calculate it. Balance-based (also called static) drawdown only counts closed trades, so an open losing position doesn’t touch your number until you exit it. Equity-based drawdown includes floating losses in real time, meaning an open trade can push you into breach territory even before you close it. Prop firms typically enforce hard daily limits, commonly around 5%, and will close an evaluation account the moment that line is crossed, so knowing which calculation method your firm uses isn’t optional homework, it’s survival information.
Most platforms recalculate the daily figure at a fixed server reset time rather than midnight in your own time zone, which trips up more traders than you’d expect. If you’re on a static drawdown structure, your ceiling doesn’t move as your balance grows, giving you a fixed number to plan around rather than a moving target. Smart traders don’t trade right up to the firm’s limit. They set a personal buffer a point or two tighter than the official rule, so a single bad fill doesn’t turn a bad morning into a terminated account. For a deeper breakdown of how daily and overall limits interact, see this explainer on calculating your real stop for daily versus overall drawdown.
Why a 20% Loss Needs a 25% Gain to Fix
Losses and gains are not symmetrical, and this is the math that should scare you straight. Lose 10% and you need an 11.1% gain just to get back to even. Lose 20% and the math gets uglier fast: you now need a 25% gain. Lose 50%, and you need a 100% gain, doubling your remaining capital just to break even. The deeper the hole, the steeper the climb, and the climb steepens faster than most traders intuitively expect.
Here’s a mental model that works without a spreadsheet: divide the drawdown percentage by (100 minus the drawdown percentage), then multiply by 100. A 30% loss needs 30 ÷ 70 × 100, or about 42.9%, to recover. Run that formula against your own average monthly return and you’ll see how many months a deep drawdown actually costs you, often far more than the weeks it took to create.
This is exactly why capping the size of any single losing stretch matters more than chasing bigger wins. A trader who limits drawdowns to 10% and recovers with an 11.1% gain is back to full strength in a fraction of the time it takes someone who let a loss run to 30%. Small losses compound in your favor. Big ones compound against you.
The Three-Tier Protocol: Green, Amber, Red
A written protocol beats a mood-based decision every time, because it removes the negotiation with yourself that happens mid-drawdown. A tiered system with pre-committed thresholds and enforced actions is what keeps professional and funded traders from cascading a bad morning into a blown account. Here’s the structure to steal and adapt:
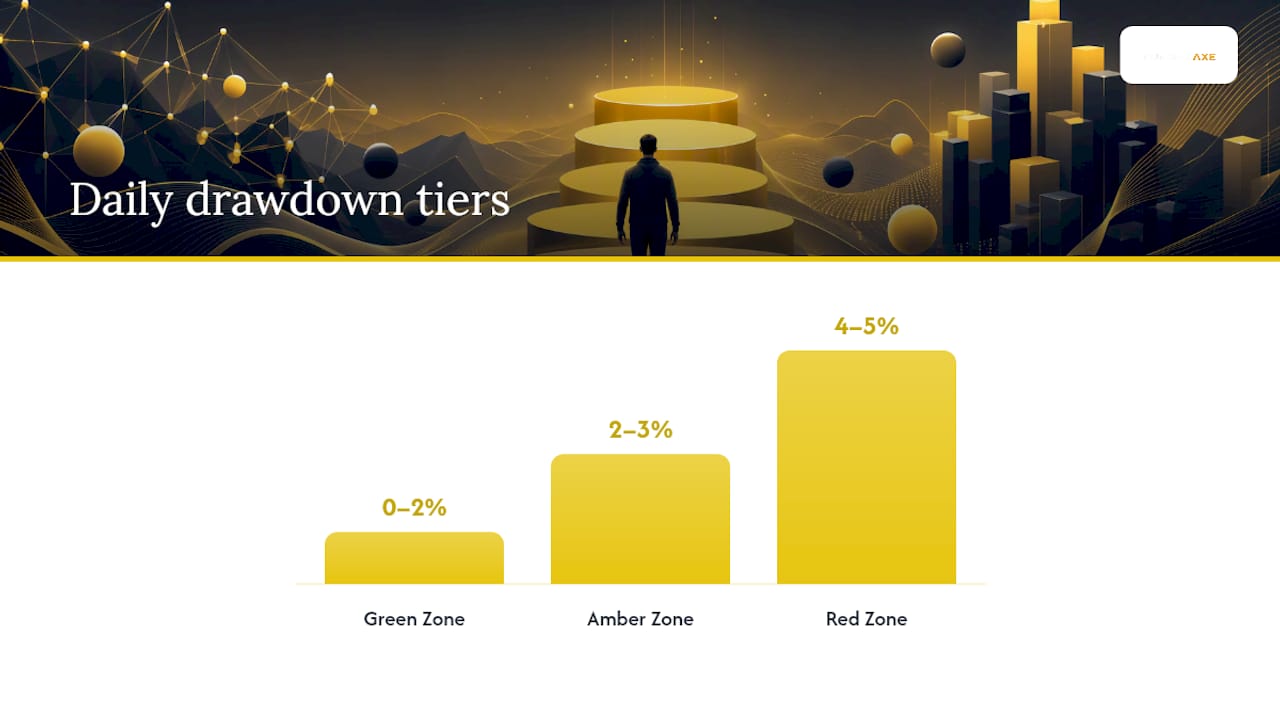
Green Zone (0 to roughly 2% daily drawdown): Trade your plan normally. No restrictions, no second-guessing, full position size on qualified setups.
Restrict yourself to only your highest-conviction, “A-grade” setups, the trades that meet every criterion in your plan without exception. Cap yourself at a maximum of three trades for the rest of the session. No new strategies, no revenge sizing, no “just one more” mentality.
Close the platform if you have to. Run a diagnostic before you touch a chart again: what type of trades caused the loss, was it one bad setup repeated or several unrelated mistakes, and did the losses start from a clear point you can identify?
If you don’t have enough trading history to know your strategy’s real worst-case run, a reasonable starting default is Amber at 2 to 3% and Red at 4 to 5%, refined after three to six months of live data once you know your actual volatility.
For funded accounts, build in a buffer below the firm’s official number. That gap is your margin for slippage, a bad fill, or a spread spike during news, and it’s the difference between a rough day and a terminated challenge.
Non-negotiable rules that make the tiers work:
- Write the thresholds down before the trading day starts, not during a losing streak.
- Journal every Amber and Red trigger: date, drawdown percent, trigger cause, and action taken.
- Re-entry after a Red stop requires a full session gap and a written diagnosis, not just “feeling better.”
- Never adjust the thresholds mid-session to justify a trade you already want to take.
How to Track Your Drawdown Before Every Trade
You can’t manage a number you’re not watching, and most drawdown breaches happen because a trader lost track of where they stood, not because they ignored a clear signal. Your drawdown percentage is simply your current balance (or equity, if you’re on an equity-based rule) subtracted from your high-water mark or starting balance, divided by that starting figure.
Run this three-step check before every single trade, not just at the start of the day:
- Calculate your current drawdown percent. Take today’s starting balance, subtract your current balance or equity, and divide by the starting balance.
- Identify your zone. Match that percentage against your Green, Amber, or Red thresholds and confirm which rules apply right now.
- Set your max risk for this specific trade. In Green, trade your normal risk per trade. In Amber, cut it in half. In Red, the answer is zero, because you’re not trading.
Most trading platforms let you set balance or equity alerts that fire at your Amber and Red thresholds, so build those in rather than relying on mental math under pressure. The goal isn’t a fancy dashboard. It’s knowing your zone before you click the buy or sell button, every single time.
The Recovery Framework: Diagnose, Pause, Right-Size, Validate, Scale
Hitting your Red threshold isn’t the end of the story, it’s the start of a process. The traders who recover fastest follow a specific sequence: stop, diagnose, cut size, validate at reduced risk, then scale back up gradually.
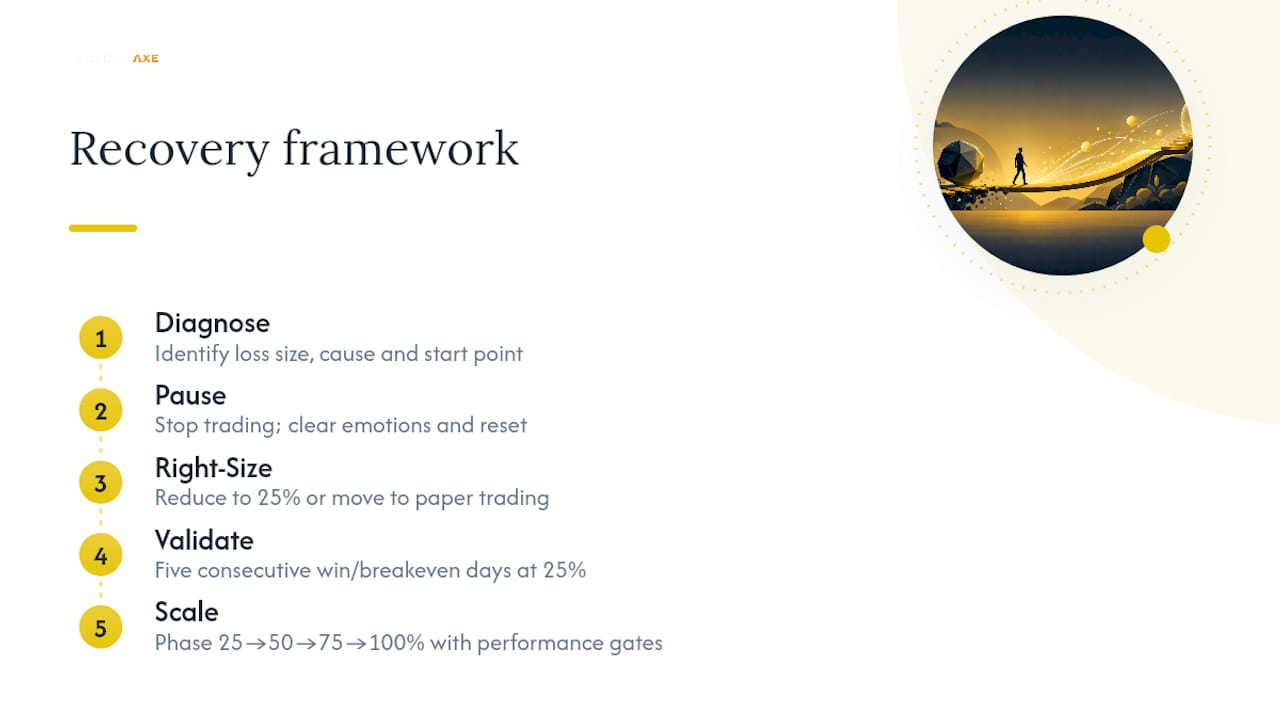
Step 1: Diagnose during the pause. Answer three questions honestly. How big was the loss relative to your normal range? What type of trades caused it, one repeated mistake or a scatter of unrelated errors? And can you pinpoint the exact trade or day where things started going wrong? Most drawdowns trace back to a single identifiable shift, a market regime change, a broken setup, or a lapse in discipline, not bad luck across the board.
A severe drawdown (a full Red stop, or several Amber triggers in a row) calls for cutting to 25%, or moving to a paper-trading account entirely for a few sessions if your confidence is genuinely shaken. There’s no shame in stepping down to simulated trades, it costs you nothing but ego and buys you clarity.
Step 3: Validate before trusting yourself again. This is the step almost everyone skips because it feels slow. Trade at your reduced size for a defined stretch, not until you “feel ready” again. A common benchmark: five consecutive winning or breakeven days at 25% size before considering a move up.
Step 4: Scale in phases, never in one jump. Move from 25% to 50%, then 50% to 75%, then 75% to full size, each step gated by consistent performance rather than a calendar date. Jumping straight from 25% back to full size after one good day is how traders re-enter their own Red zone within a week.
Build these gates into your written trading plan so they’re not up for debate when you’re emotionally invested in getting back to full size fast. A trading plan built to survive a funded account should have this recovery sequence baked in before you ever need it, not improvised in the moment.
Position Sizing by Drawdown Band, With Real Numbers
Numbers stick better than rules stated in the abstract. Here’s how drawdown severity maps to position size and per-trade risk, using a $50,000 account as the working example.
The moment that account slides into Amber territory, that risk should drop to $250 per trade, half the dollar amount on half the size. It’s a mechanical adjustment, not a judgment call you make trade by trade.
Reclaiming full size isn’t about the calendar, it’s about proof. The clearest re-entry gate is a trade-count or consistency requirement: five winning or breakeven sessions at reduced size, or a defined number of trades (commonly 15 to 20) that match your plan’s normal win rate before stepping back up. Scaling exposure based on distance from your account’s high point, rather than gut feeling, is the same logic professional drawdown-control systems use at the portfolio level, and it works just as well for a single trading account as it does for a fund.
Why Revenge Trading Makes Drawdown Worse
A losing trade triggers a very human urge to win it back immediately, and that urge is exactly what turns a manageable Amber drawdown into a full account breach. Behavioral post-mortems on losing streaks consistently show that traders who keep trading through a drawdown, rather than stopping to reset, compound their losses in the large majority of cases. The pattern has a name: revenge trading, and it almost always shows up as bigger size on worse setups.
Three guardrails neutralize it before it starts. First, a forced break, even 20 minutes away from the screen, breaks the emotional momentum that drives oversized trades. Second, a hard cap on trades per day removes the option to “make it back” through volume. Third, mandatory journaling before every trade after an Amber trigger forces a written justification, which is often enough to expose a bad idea before it costs you money.
Pro Tip: Before increasing size after a loss, write down the exact reason on paper. If the reason is “to get back what I lost,” don’t take the trade. A pre-committed checklist at this exact decision point measurably reduces the odds of an emotional trade by forcing a pause you’d otherwise skip.
Practicing the Protocol on a FundedAxe Challenge
Fundedaxe evaluations run on static, balance-based drawdown, which gives you a fixed ceiling to plan buffers against rather than a target that shifts with every winning trade. That structure makes the three-tier protocol easy to apply directly: set your personal Amber and Red lines a point or two inside the challenge’s published limit, and treat them exactly as seriously as the firm’s own rule.
Because the platform supports news trading, weekend holding, and full EA and algorithmic trading, you can test your drawdown rules across the exact market conditions your real strategy trades, not a stripped-down demo environment. Start with the free $1,000 simulated trial account to build the habit before any money is on the line, or move into a low-cost Pay After Pass evaluation once your tier discipline is consistent.
The Discipline Nobody Talks About
Every trading forum obsesses over entries and exits. The tiered protocol in this article isn’t clever, it’s just consistently applied, and that consistency is the entire point.
Survival is the real metric that matters, not any single day’s profit and loss. A trader who protects capital through a hundred small, boring Amber pauses will still be standing when a trader who ignored every one of them has already blown two accounts chasing the loss back.
— Jean
Practice the Protocol Before You Trade It Live
This firm is a practical way to stress-test a daily drawdown strategy without risking a dollar of your own capital first: every challenge runs on simulated funds, so a Red-zone mistake costs you a reset, not your savings. Start with the free $1,000 trial account, no card and no deposit required, and run your Green, Amber, and Red thresholds against real market conditions including news events and weekend holds.

Once your tiering holds up under pressure, move into a real evaluation. The Pay After Pass model lets you start for $9.99 upfront and only pay the remaining challenge fee once you’ve actually passed, which means you can validate your recovery framework on an account up to $400,000 before committing the full fee. Compare account sizes and structures on the package comparison page and pick the evaluation that matches how you already trade.
Sources
The recovery math and thresholds in this article draw on a handful of specific sources worth reading in full if you want to dig into the mechanics:
- How to Recover from a Trading Drawdown: A Step-by-Step Framework
- Drawdown control at the portfolio level, explained
This article is general information, not a substitute for advice from a qualified financial advisor. Consult a qualified financial professional about your own circumstances before acting on anything here.
FAQ
How Much Do Traders With $10,000 Accounts Typically Make Per Day?
There’s no reliable universal figure here, and daily results swing widely by strategy and market conditions, which is exactly why a drawdown protocol matters more than chasing a specific daily target.
Why Is a 50% Drawdown So Much Harder to Recover From Than a 10% One?
Recovery math is asymmetric: a 10% loss needs only an 11.1% gain to break even, while a 50% loss needs a full 100% gain, because you’re recovering from a much smaller remaining capital base.
Is There a Real Example of a Trader Making Millions in Minutes?
Extreme short-window trading stories exist in market lore, but they’re not a reproducible strategy and have no bearing on a sound daily drawdown plan, which is built around consistent, repeatable risk control rather than outlier events.
Does Fundedaxe Support Practicing a Daily Drawdown Strategy?
Yes. Fundedaxe evaluations run on static, balance-based drawdown with no time limits, letting you set personal Green, Amber, and Red thresholds and test them through the free $1,000 trial or a Pay After Pass challenge.
Recommended
Educational content only, not financial advice. All FundedAxe accounts use simulated funds. No strategy guarantees a return.